
Design & Planning Automation · Construction Digital Twin · Asset Digital Twin
Data visualisation and BIM model dashboards
Project data. Readable by everyone.
We extract and visualise BIM model data and create organised datasets based on the job requirements, explored through interactive dashboards.
Data Visualisation means taking the information content of BIM models out of the modelling software, in a form anyone can read. Owners, site managers, procurement and maintenance teams should not have to open a model to know how many doors there are, which rooms are complete or which elements are missing a parameter.
BIMON extracts the data automatically, through a controlled process, and organises them into datasets that match the job requirements. From there we build bills of quantities (BoQ), custom extractions and dashboards. Some dashboards let you navigate the data; others link the data to the 3D model, so selecting a value highlights the matching elements.
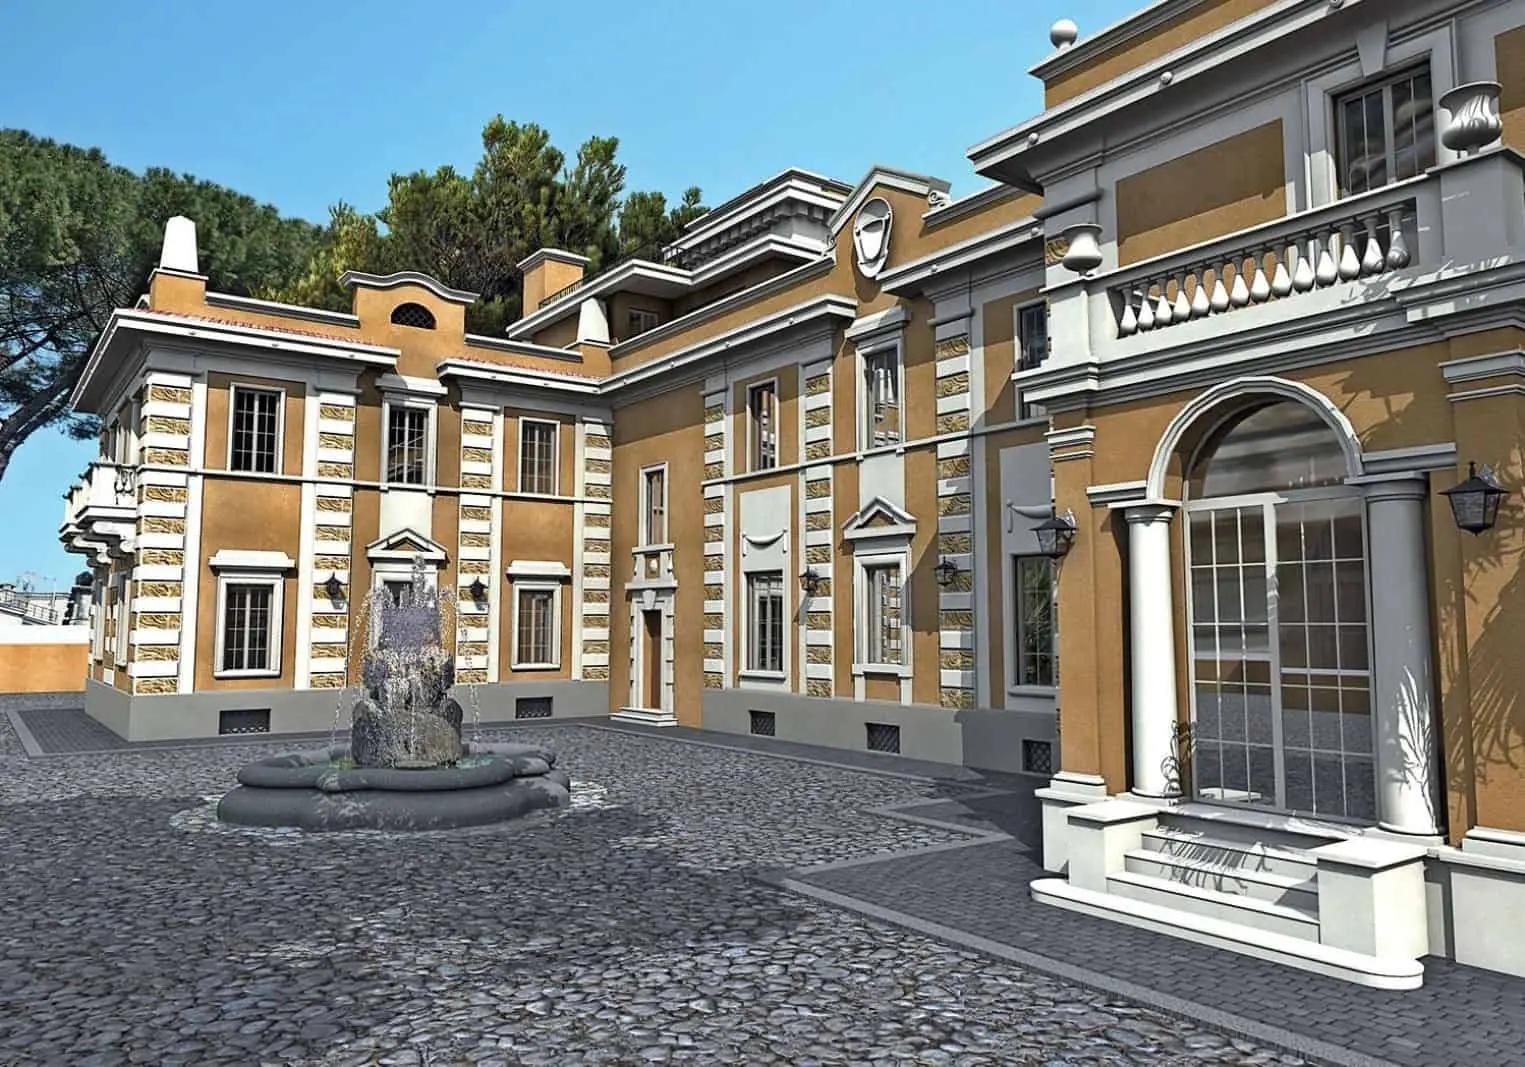
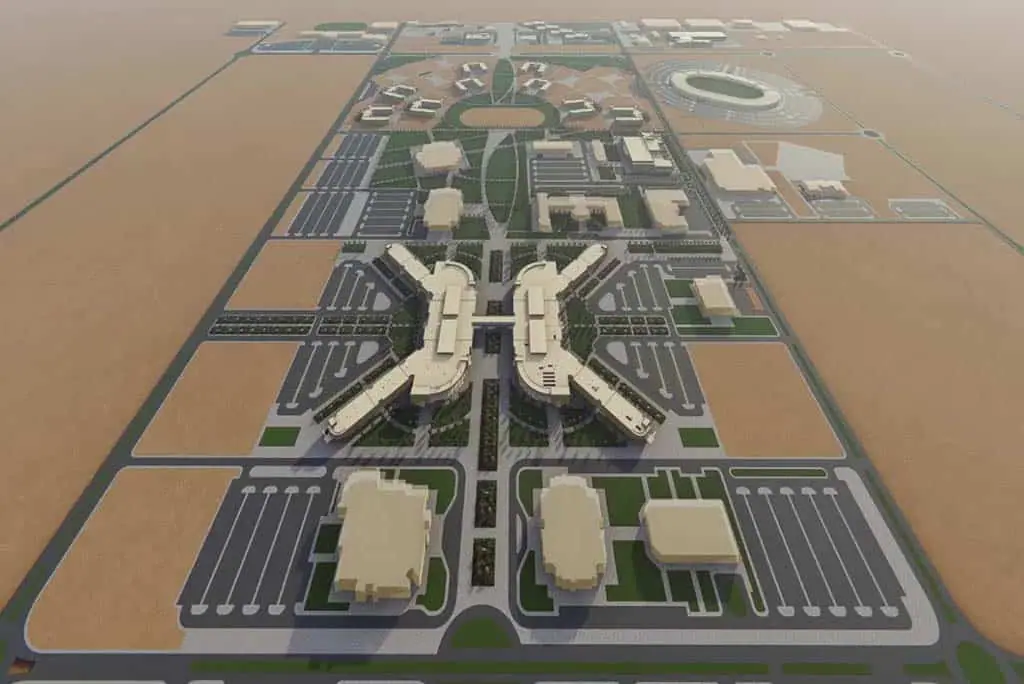
At Villa Serena in Rome we built Power BI dashboards to display and monitor the model's information content over time: at each milestone a new extraction updates the data automatically. For MIND Milano Innovation District and for the King Faisal Air Academy in Riyadh, dashboards are the tool owners and suppliers use to follow project data and non-conformities.
You need it when information exists but only modellers can reach it, when tenders and procurement need reliable quantities, or when the owner wants to follow progress without relying on manual reports.
How we work
- 1
Requirements
We define which data are needed, by whom and how often they must be updated.
- 2
Extraction
We automate extraction from the models and organise the datasets.
- 3
Dashboards
We build interactive views with filters and, where useful, 3D model navigation.
- 4
Updates
At each milestone a new extraction refreshes the data with no manual work.


Frequently asked questions
What data can be extracted from a BIM model?+
Anything the model holds as a parameter: quantities, materials, areas and volumes, codes, phases, progress status, maintenance information. Extraction quality depends on how the model was structured, which is why data rules should be set early.
Which tools do you use for the dashboards?+
Often Power BI, as on Villa Serena, but we adapt to the Business Intelligence tools the client already uses. Model navigation dashboards add a 3D viewer linked to the data.
What is the difference between Data Visualisation and Data Analysis?+
Data Visualisation makes data accessible and organised: extractions, bills of quantities, browsing dashboards. Data Analysis cross-references and monitors them to support strategic choices, for example by comparing different sources or tracking a trend. The two services often share the same data base.
Let's build your digital future together.
Tell us about your asset, your tender or your idea. A BIMON engineer will get back to you within one working day.